Real Time Images of the Sun
SOHO EIT 304
|
SOHO EIT 284 Animated
|
LASCO/C2
|
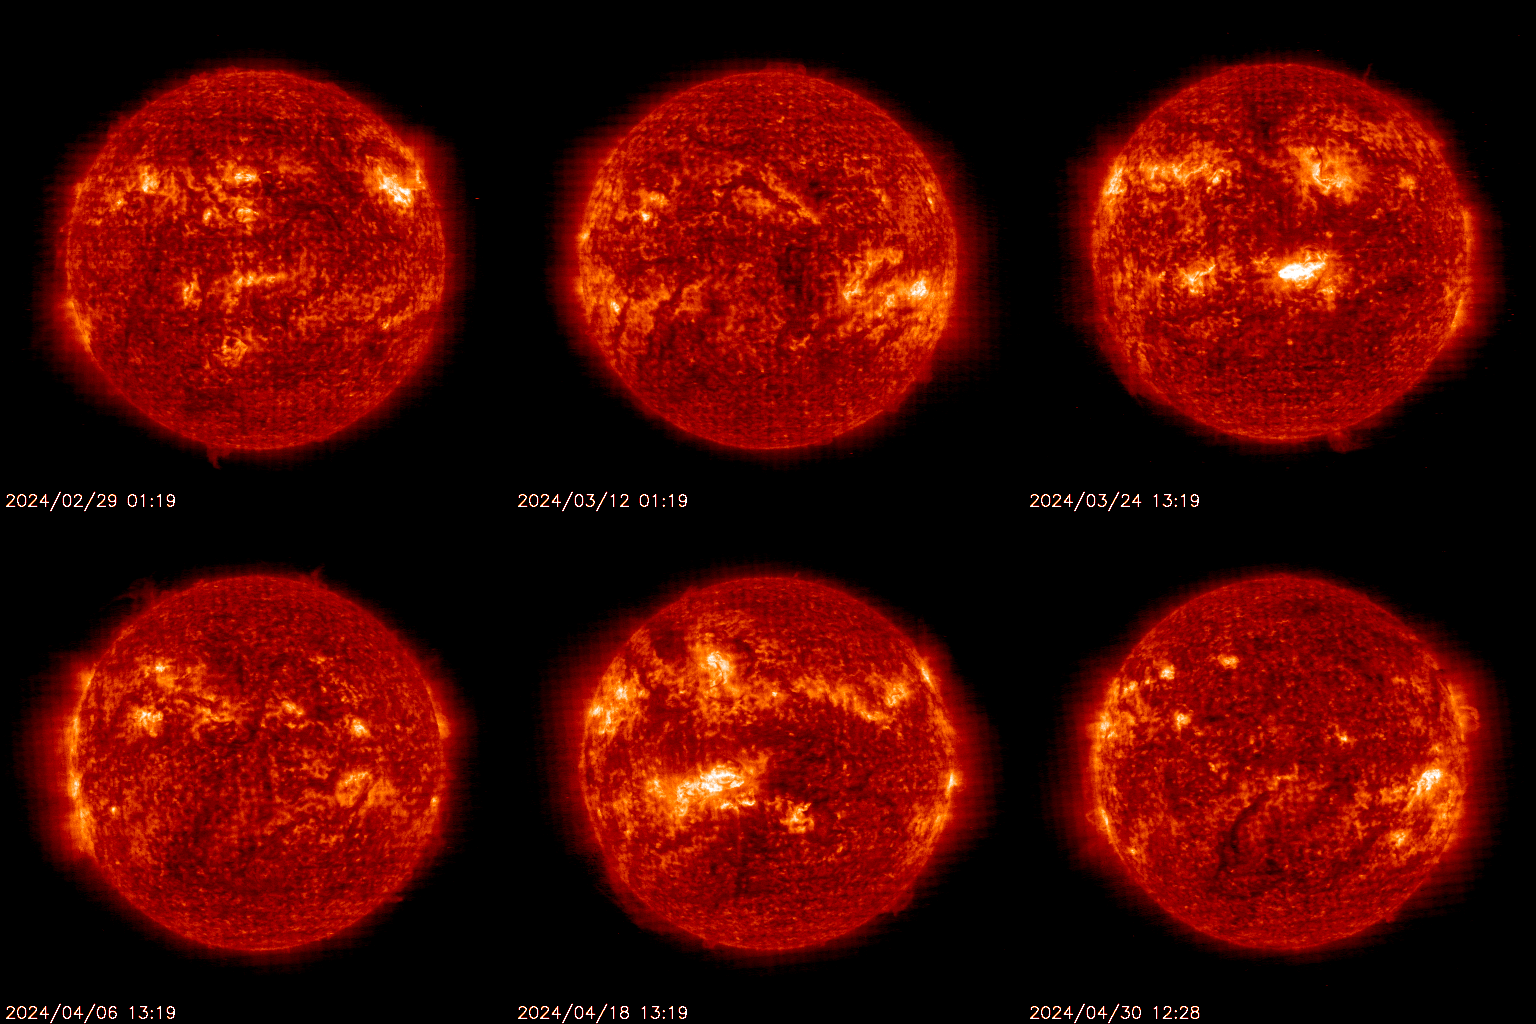
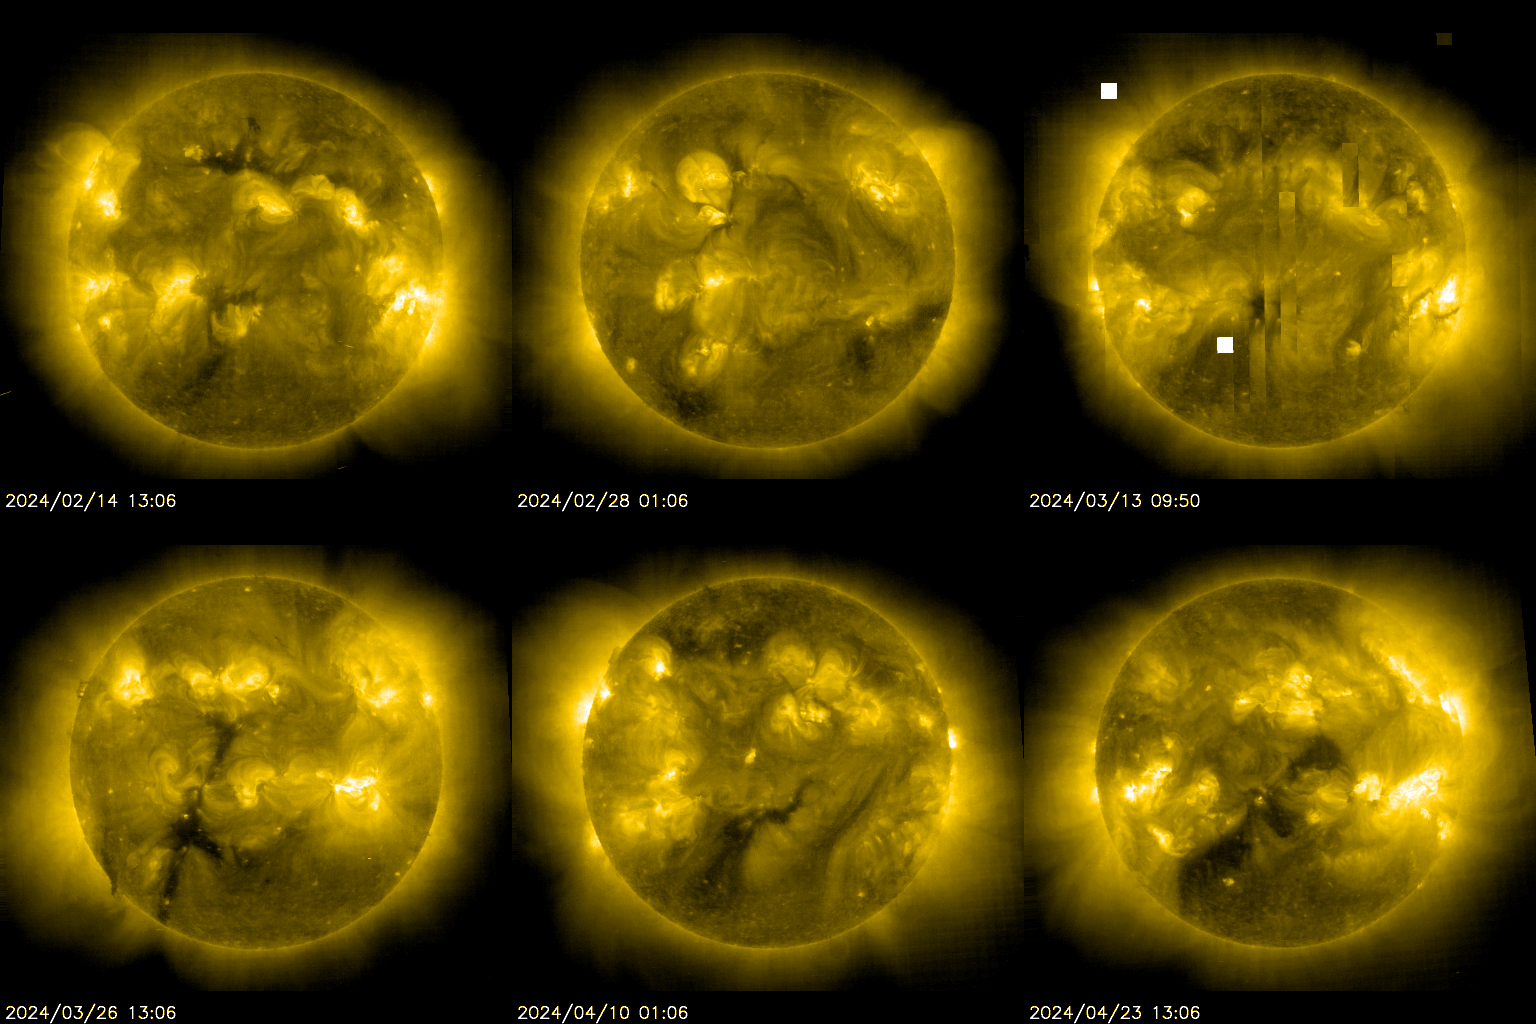
The sun is constantly monitored for sun spots and coronal mass ejections. EIT (Extreme ultraviolet Imaging Telescope) images the solar atmosphere at several wavelengths, and therefore, shows solar material at different temperatures. In the images taken at 304 Angstrom the bright material is at 60,000 to 80,000 degrees Kelvin. In those taken at 171 Angstrom, at 1 million degrees. 195 Angstrom images correspond to about 1.5 million Kelvin, 284 Angstrom to 2 million degrees. The hotter the temperature, the higher you look in the solar atmosphere.
Solar activity reached moderate levels during the reporting period. The strongest event was a long-duration, double-peaked M1.2 flare from Region 4366 (N14W90, Fhc/beta-gamma-delta). Region 4366 was also the source of six C-class flares. Region 4371 (S23W41, Hrx/alpha) and Region 4374 (N11E51, Cso/beta) produced the remaining C-class activity, with Region 4373 producing a long-duration C3.2 flare peaking at 10/1910Z. Notably, the bulk of Region 4366 has now rotated off the visible disk. Regions 4371 (S23W41, Hrx/alpha) and 4369 (S02W56, Hrx/alpha) exhibited decay in extent, while other numbered regions remained relatively static. A new region is currently rotating into view over the northeast limb (near N16); however, characterization of its complexity and extent is pending further observation. Around 10/1910Z, a large filament (located near N15W25) lifted off and disappeared from GONG H-alpha imagery. Initial coronagraph imagery from LASCO C2 at 10/1948Z revealed an eruption likely superimposed over a separate eruption from S22W80 (first visible in C2 at 10/1924Z). Evaluation of both eruptions remains ongoing.
Solar Activity Forecast
Issued: 2026 Feb 11 1230 UTC
Solar activity is expected to be at low through 13 Feb. Probability for M-class (R1-R2) and X-class (R3 or greater) flares has dropped significantly as Region 4366 continues to rotate behind the western limb with a slight chance (10-15%) for M- and X-class flaring 11-13 Feb. Energetic
Real Time Solar X-ray and Solar Wind
Solar Cycle Progression
Solar Cycle chart updated using the latest ISES predictions. |
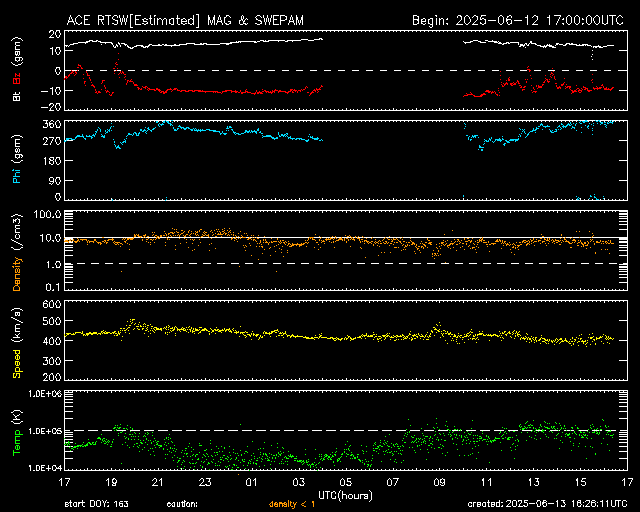
Real-Time Solar Wind
Real-Time Solar Wind data broadcast from NASA's ACE satellite. |
The Solar Cycle is observed by counting the frequency and placement of sunspots visible on the Sun. Solar minimum occurred in December, 2008. Solar maximum is expected to occur in May, 2013.
Solar X-ray Flux This plot shows 3-days of 5-minute solar x-ray flux values measured on the SWPC primary and secondary GOES satellites. |
Satellite Environment Plot The Satellite Environment Plot combines satellite and ground-based data to provide an overview of the current geosynchronous satellite environment. |
Auroral Activity Extrapolated from NOAA POES
Northern Hemi Auroral Map
|
Southern Hemi Auroral Map
|
Instruments on board the NOAA Polar-orbiting Operational Environmental Satellite (POES) continually monitor the power flux carried by the protons and electrons that produce aurora in the atmosphere. SWPC has developed a technique that uses the power flux observations obtained during a single pass of the satellite over a polar region (which takes about 25 minutes) to estimate the total power deposited in an entire polar region by these auroral particles. The power input estimate is converted to an auroral activity index that ranges from 1 to 10.
Credits:
Space Weather Images and Information (excluded from copyright) courtesy of: NOAA / NWS Space Weather Prediction Center, Mauna Loa Solar Observatory (HAO/NCAR), and SOHO (ESA & NASA).Space Weather links:
3-Day Forecast of Solar and Geophysical Activity
Space Weather Now
Real-Time Solar Wind
Solar and Heliospheric Observatory (SOHO)
The Very Latest SOHO Images


